I.
The
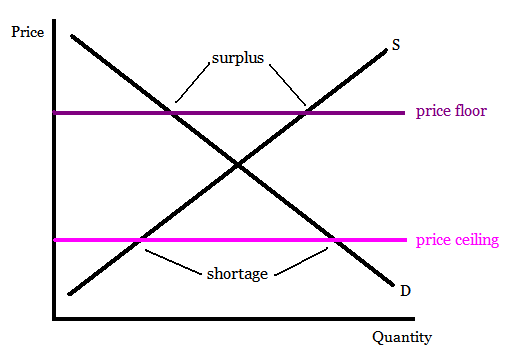
point at which the supply curve intersects with the demand curve. Still
efficient
II.
Excess
Demand: occurs when quantity demanded is greater than quantity supplied.
i.
QD>QS.
ii. A shortage.
III.
Price
ceiling: When the State puts a legal limit on how high a price of a product can
be.
i.
Found
under the equilibrium point. Also a shortage.
ii. State sets a limit on flu shots. Eventually the
supply will run out.
iii. Shown by the gap of the ceiling between supply
and demand lines on the y-axis.
IV.
Excess
Supply: quantity supplied is greater than quantity demanded.
i.
QS>QD
ii. A surplus
iii. Producers have inventories that they cannot rid.
Creates a price floor
V.
Price
Floor: the lowest legal price a commodity can be sold at.
i.
Minimum
wage. Can't remain competitive.
Nice, informative notes. Make sure you include a supplement such as an image or video to help recall the material. A graph would be nice here. Also, text me back.
ReplyDeleteAn example of a price ceiling would be rent control.
ReplyDeleteOrganized notes, however the set up of the blog is set up where it has no table of contents. Thus, it is hard to navigate through the blog. Overall, well done "Ethanomics".
ReplyDelete